View Process Map
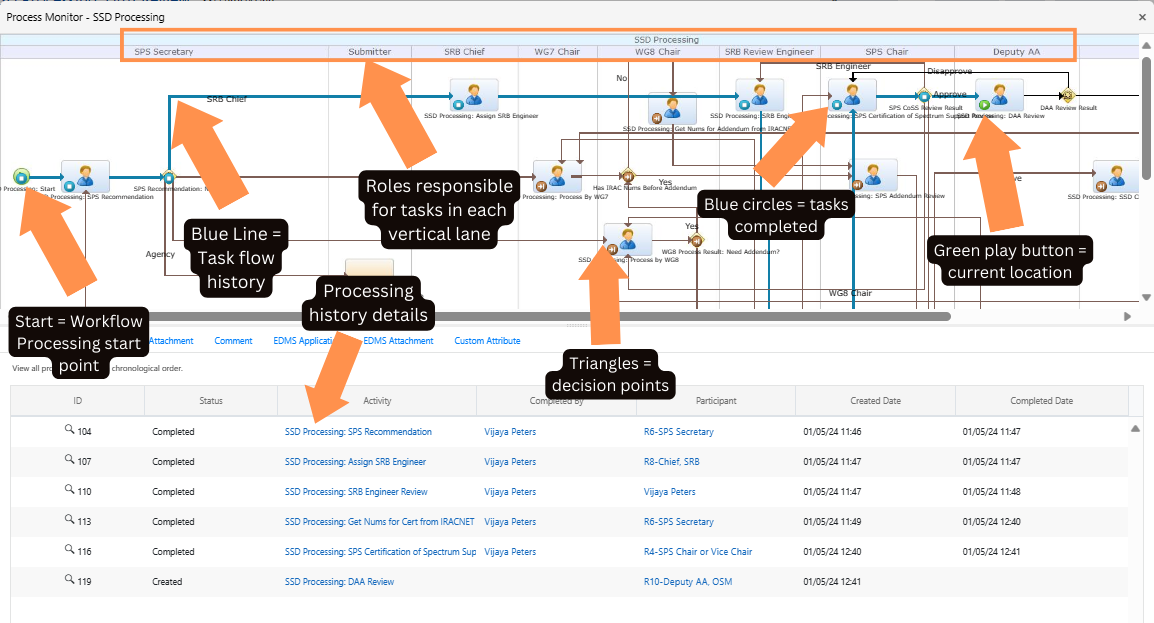
The workflow contains a process map which is essentially a highly detailed flow chart that displays (1) an overview of task flows, (2) the history of a particular request within the task flow, and (3) where the request is currently situated within that flow. Although the map is necessarily complex, some users may find it helpful in gaining a more complete understanding of the larger processing picture.
The process map is accessible in two ways:
- The Active Requests Table on the main dashboard.
- The Tasks Page
The Active Requests Table
To quickly view the Process Map from the main dashboard, first locate the task in the Active Requests Table.

Then select the request and click the  button to view the Process Map.
The Task Form
The Process Map can also be accessed in the task form. Select the  button and then click
  to display the map.

The Process Map provides the history and current status of a specific task, it is formatted differently than the Task and Status Diagram.
- Tasks progress primarily horizontally through the Process Map.
- The Process Map only shows the subsection of NTIA processing where the request is currently located; either SPS Prep, SRB Processing, or SSD Processing is indicated at the top of the map in the blue header.
- The Process Map is not organized according to the evaluation steps, but according to the user role performing each step of the business process. Each horizonal section indicates the domain of a different user.
- Instead of pills indicating processes, the process map uses human icons inside rectangles as seen here:
 .
.
When the process map is selected for a particular request, the following visuals cues provide key information:
- The green play
 button identifies the request’s task flow position – i.e., the current task that needs to be completed.
 - The blue line identifies the request’s general history within the task flow
- Blue circles
 identify the request’s specific history within the task flow – i.e., previous task and process steps that have been completed
 - Triangles represent decision gates within the task flow
- Headers and vertical lines indicate the roles responsible for tasks in each vertical lane
- The process history table located below the map, details the history of all previous tasks completed within the workflow associated with the request, in chronological order

To view additional details regarding the processing history of a specific request, users may click on items in the Activity, Completed By, and Participant columns within the process history table to view additional details, such as participant contact information.

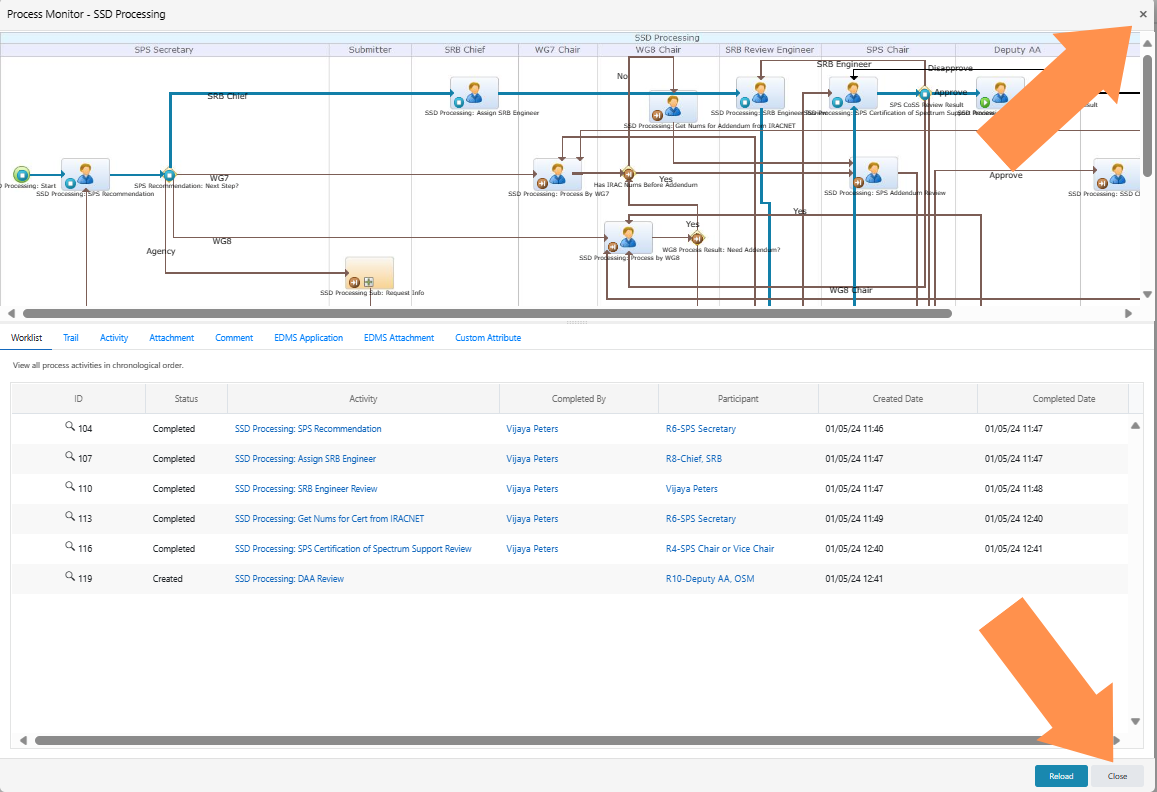
To exit the map, select the X in the top-right corner or select  .
.

To view less detailed flow charts that provide overviews of SRB and SSD task flow processing, see SRB, SSD, and SPS Processing Overview.
To understand the overall structure of NTIA processing, users should consult the Task and Status Diagram. A PDF version of the Task and Status Diagram is available here.
